

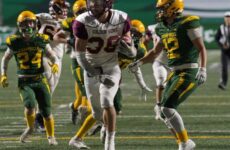
Luke Willson, TE for the Rice Owls, had 3 catches in this weekends game versus #5 Texas. The St. Thomas of Villanova and Essex Ravens grad is in his redshirt sophmore year at Rice.
Below are the stats for the game. Willson was the third leading receiver for the Owls on the day.
Scoring Summary (Final)
2010 Rice Football
#5 Texas vs Rice (Sep 04, 2010 at Houston, Texas) Texas (1-0) vs. Rice (0-1)
Date: Sep 04, 2010 • Site: Houston, Texas • Stadium: Reliant Stadium • Attendance: 70445
| Score by Quarters | 1 | 2 | 3 | 4 | Score |
| Texas | 0 | 24 | 7 | 3 | 34 |
| Rice | 3 | 7 | 0 | 7 | 17 |
| SCORING SUMMARY | UT -RICE | |||
| 1st | 08:04 | RICE | Boswell, Chris 42 yd field goal | |
| 14 plays, 60 yards, TOP 6:56 | 0 – 3 | |||
| 2nd | 14:55 | UT | Tucker, Justin 51 yd field goal | |
| 4 plays, -4 yards, TOP 2:10 | 3 – 3 | |||
| 08:02 | UT | Newton, Tre’ 1 yd run (Tucker, Justin kick) | ||
| 9 plays, 69 yards, TOP 4:06 | 10 – 3 | |||
| 06:24 | UT | Robinson, Keenan 10 yd fumble recovery (Tucker, Justin kick) | ||
| 17 – 3 | ||||
| 01:28 | UT | Newton, Tre’ 2 yd run (Tucker, Justin kick) | ||
| 9 plays, 50 yards, TOP 3:26 | 24 – 3 | |||
| 00:04 | RICE | Kitchens, Randy 47 yd pass from McHargue, Taylor (Boswell, Chris kick) | ||
| 4 plays, 75 yards, TOP 1:24 | 24 – 10 | |||
| 3rd | 00:53 | UT | Newton, Tre’ 1 yd run (Tucker, Justin kick) | |
| 9 plays, 46 yards, TOP 3:42 | 31 – 10 | |||
| 4th | 07:33 | UT | Tucker, Justin 26 yd field goal | |
| 10 plays, 72 yards, TOP 4:21 | 34 – 10 | |||
| 00:24 | RICE | Ross, Charles 2 yd run (Boswell, Chris kick) | ||
| 3 plays, 20 yards, TOP 0:19 | 34 – 17 |
| Kickoff time: 2:36 pm • End of Game: 5:39 • Total elapsed time: 3:03 Referee: David Smith • Umpire: Rimas Kozica • Linesman: Jerry Harris • Line judge: Hugo Cruz • Back judge: Paul Jones • Field judge: Mark Windham • Side judge: Chris Bynum • Temperature: 72 • Wind: • Weather: Played Indoors |
| Team Statistics |
Team Statistics (Final)
2010 Rice Football
#5 Texas vs Rice (Sep 04, 2010 at Houston, Texas)
| Team Totals | UT | RICE |
| FIRST DOWNS | 20 | 14 |
| Rushing | 11 | 8 |
| Passing | 8 | 5 |
| Penalty | 1 | 1 |
| NET YARDS RUSHING | 197 | 88 |
| Rushing Attempts | 46 | 42 |
| Average Per Rush | 4.3 | 2.1 |
| Rushing Touchdowns | 3 | 1 |
| Yards Gained Rushing | 205 | 143 |
| Yards Lost Rushing | 8 | 55 |
| NET YARDS PASSING | 172 | 131 |
| Completions-Attempts-Int | 14-24-0 | 12-18-1 |
| Average Per Attempt | 7.2 | 7.3 |
| Average Per Completion | 12.3 | 10.9 |
| Passing Touchdowns | 0 | 1 |
| TOTAL OFFENSE YARDS | 369 | 219 |
| Total offense plays | 70 | 60 |
| Average Gain Per Play | 5.3 | 3.7 |
| Fumbles: Number-Lost | 1-1 | 1-1 |
| Penalties: Number-Yards | 4-30 | 4-40 |
| PUNTS-YARDS | 2-84 | 7-315 |
| Average Yards Per Punt | 42.0 | 45.0 |
| Net Yards Per Punt | 42.0 | 36.1 |
| Inside 20 | 1 | 2 |
| 50+ Yards | 0 | 1 |
| Touchbacks | 0 | 1 |
| Fair catch | 2 | 1 |
| KICKOFFS-YARDS | 7-452 | 4-163 |
| Average Yards Per Kickoff | 64.6 | 40.8 |
| Net Yards Per Kickoff | 44.6 | 28.0 |
| Touchbacks | 0 | 0 |
| Punt returns: Number-Yards-TD | 4-42-0 | 0-0-0 |
| Average Per Return | 10.5 | 0.0 |
| Kickoff returns: Number-Yds-TD | 4-51-0 | 7-140-0 |
| Average Per Return | 12.8 | 20.0 |
| Interceptions: Number-Yds-TD | 1-0-0 | 0-0-0 |
| Fumble Returns: Number-Yds-TD | 1-10-1 | 0-0-0 |
| Miscellaneous Yards | 0 | 0 |
| Possession Time | 30:56 | 29:04 |
| 1st Quarter | 7:23 | 7:37 |
| 2nd Quarter | 7:41 | 7:19 |
| 3rd Quarter | 9:43 | 5:17 |
| 4th Quarter | 6:09 | 8:51 |
| Third-Down Conversions | 7 of 14 | 4 of 14 |
| Fourth-Down Conversions | 0 of 1 | 0 of 0 |
| Red-Zone Scores-Chances | 4-5 | 2-2 |
| Touchdowns | 3-5 | 1-2 |
| Field goals | 1-5 | 1-2 |
| Sacks By: Number-Yards | 3-32 | 0-0 |
| PAT Kicks | 4-4 | 2-2 |
| Field Goals | 2-4 | 1-2 |
| Individual Statistics |
Individual Statistics (Final)
2010 Rice Football
#5 Texas vs Rice (Sep 04, 2010 at Houston, Texas)
| Rice | ||||||||||||||||||||||||||||||||||||||||||||||||||||||||||||||||
|
||||||||||||||||||||||||||||||||||||||||||||||||||||||||||||||||
|
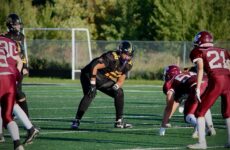


 Season Preview: LeBoldus LB Goldstone ready to lead the Golden Suns back into the fight
